DynaCubes Unlocks the Power of Data Visualization
Dynamic Charts and Graphics
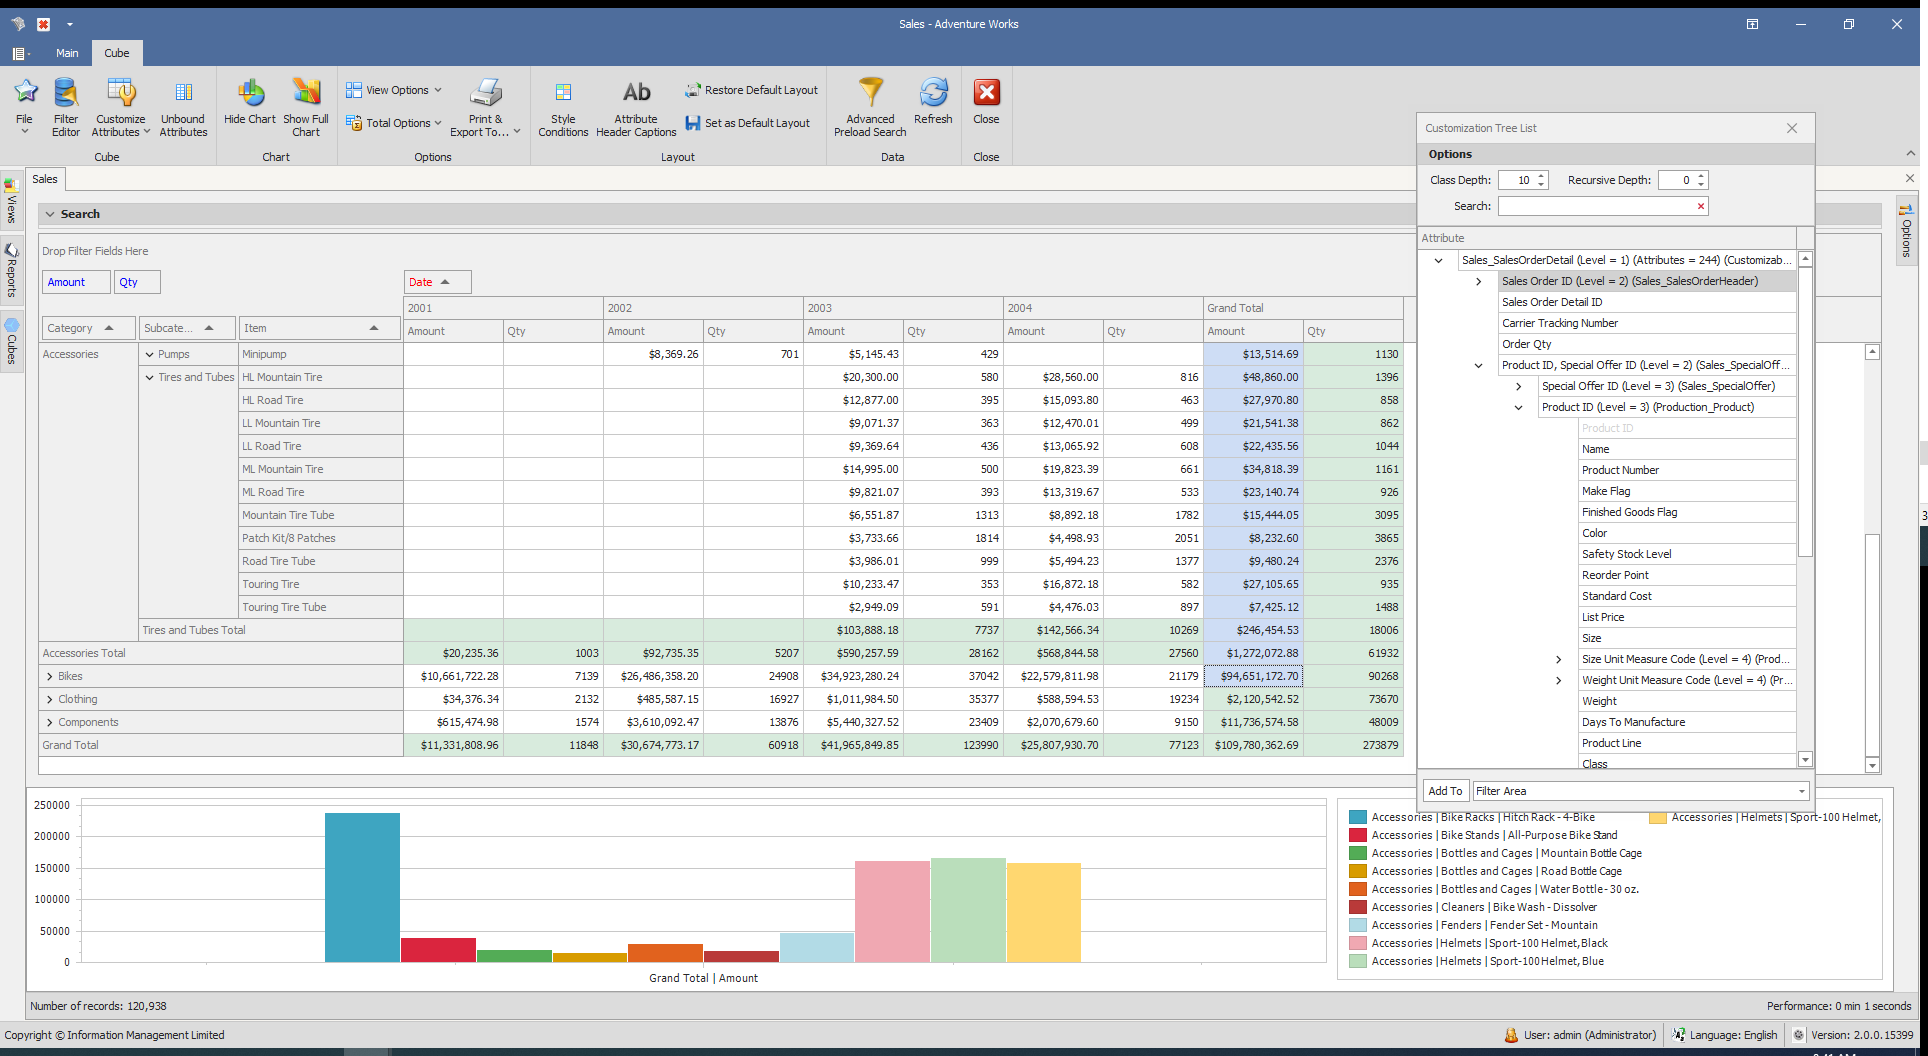
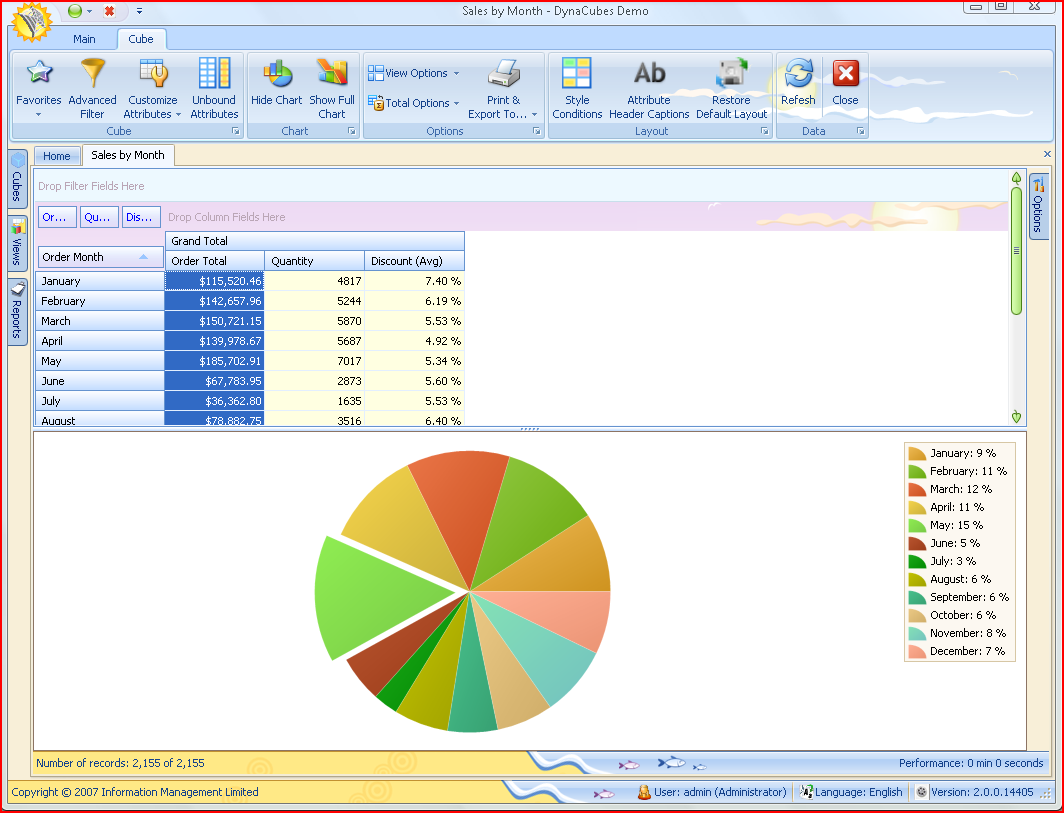
Our Charts and Graphics subsystem offers over 33 types of charts, allowing you to visualize data in the most meaningful way. Highlight measures on the cube to get immediate feedback, control chart axes, and export charts in various formats including PDF, HTML, and Excel. Customize your charts with extensive options for colors, styles, and layouts to meet your specific needs.


Using the Print Chart Report Feature
Step 1
Access the Print Chart Report
Navigate to the chart you wish to print and select the ‘Print Chart Report’ option from the menu.
Step 2
Customize Your Report
Adjust the settings such as headers, footers, scaling, and orientation to fit your specific needs.
Step 3
Print or Save
Choose to print your report directly or save it in various formats like PDF, Excel, or image files.
Key Features of Chart Wizard
Diverse Chart Types
Select from over 33 different chart types including bar, line, pie, and more to best represent your data.
Interactive Customization
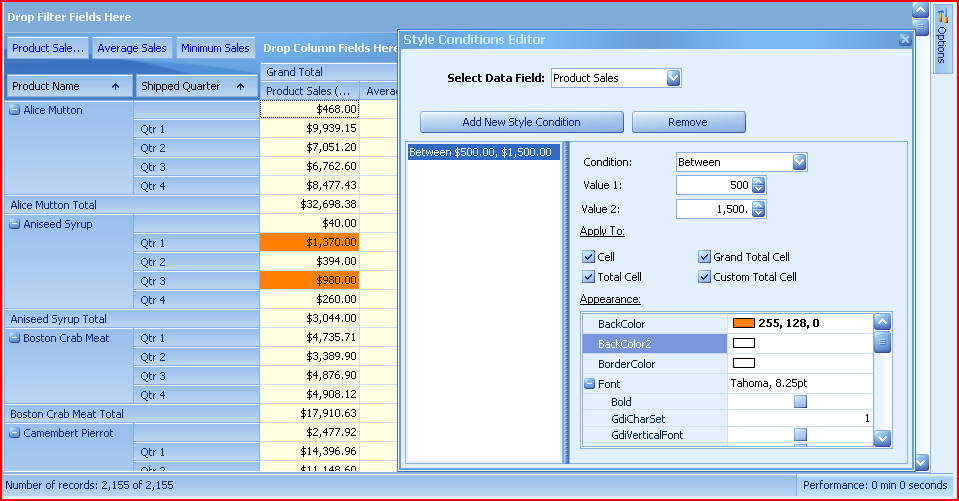
Customize colors, styles, and properties interactively to create visually appealing charts that meet your exact specifications.
DynaCubes BI
Discover Our Full Range of Tools
Unlock the full potential of Information Management Ltd. by exploring our comprehensive suite of data management and reporting tools. Start optimizing your data processes today!


